Select a Chart Type
What information do you want to show? This is always the first question you must ask yourself when creating a chart. For example, if you want to show what percentage each salesperson contributes to the bottom line, try a pie chart, which is great for showing how parts relate to a whole. Or maybe you'd prefer to show how each salesperson's been doing over the course of the year. In that case, a line chart might work best. That way you could plot each person's sales numbers through time and see who's improving.
Depending on what values you chose to display in your chart, When Quickbase is connecting the dots on your line chart, some numbers may be missing. Whenever a line chart encounters a missing value, it tells you so with a dotted line. Quickbase treats it as a zero, but lets you know that it has no actual value for that x-axis point with a dotted line.
Quickbase offers the following chart types:
Tip App managers can enable 3D shading for all charts, instead of the default, flat presentation. To enable 3D shading, click Branding on the App Settings page and then select Display 3D shading on charts.

Pie
If you want to show proportions, use a pie chart. Each section of the pie chart represents what portion of the whole a segment occupies. For instance, the image below shows a break down of issues by status. Open issues are 20% of the total issues and display as 1/5 of the pie chart.
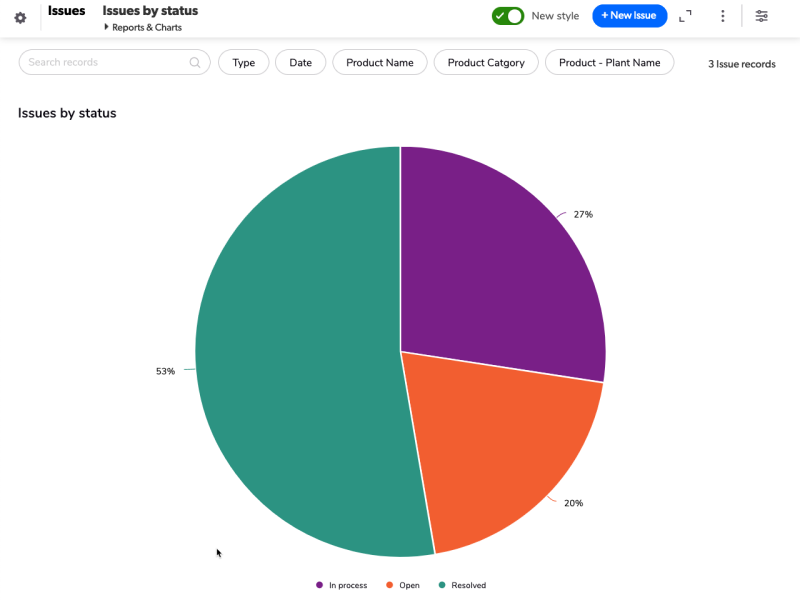
Pie Chart
Bar
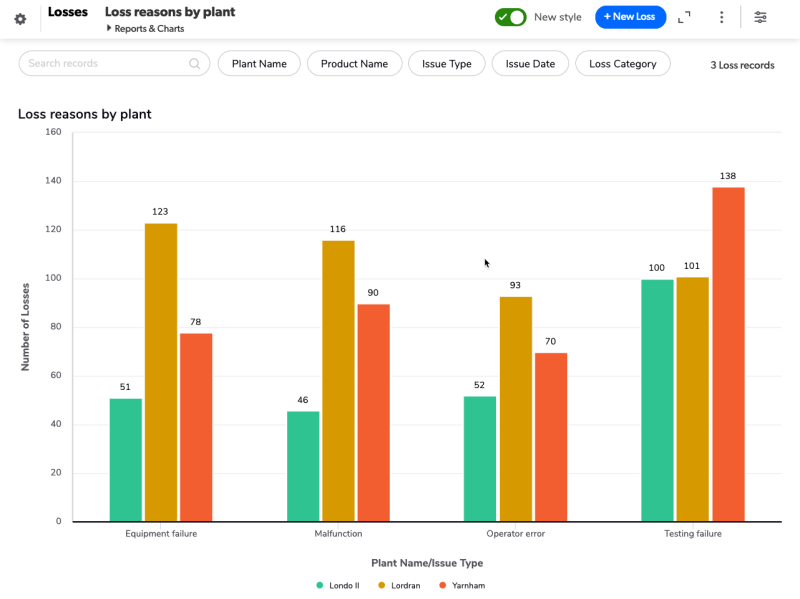
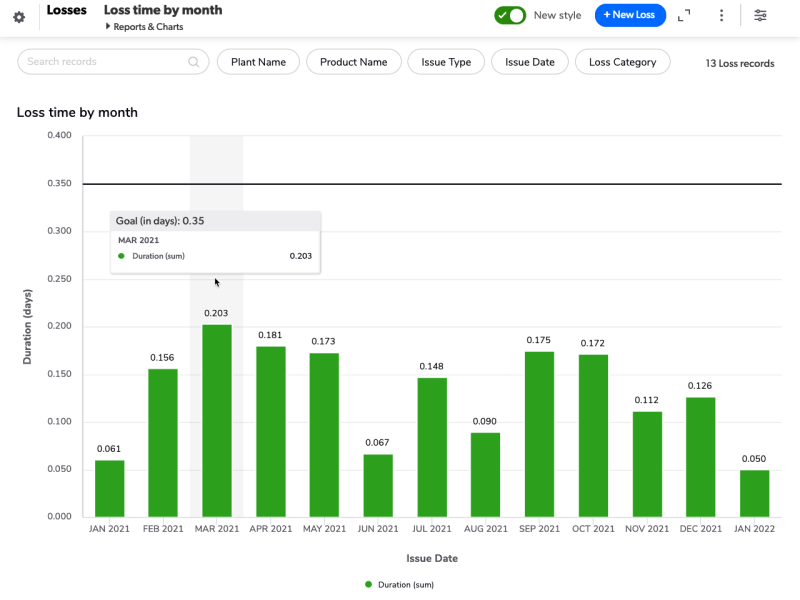
If you want to compare values, try a bar chart. Which month was the best for business? Compare them all with a bar chart. If you want, you can break down bar chart numbers even further by including additional details.
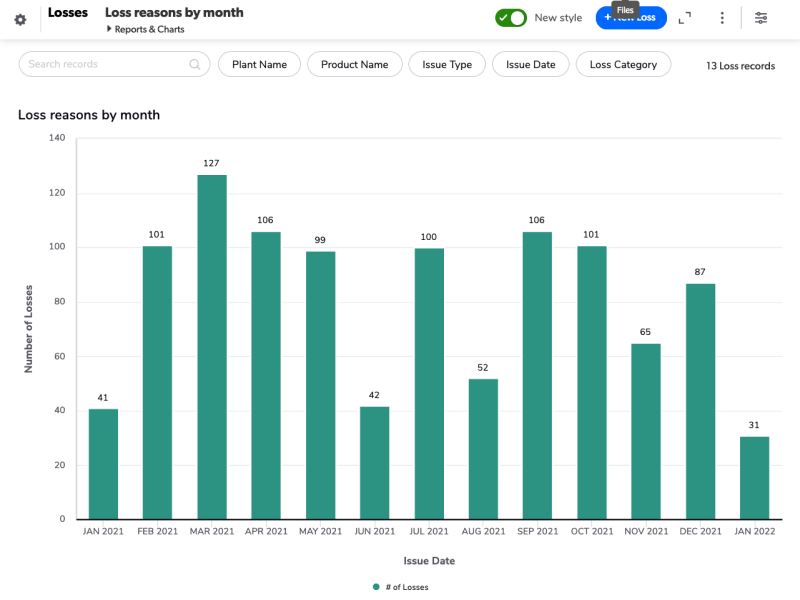
You can also add a goal line to a bar chart to measure performance against a goal.
Horizontal Bar
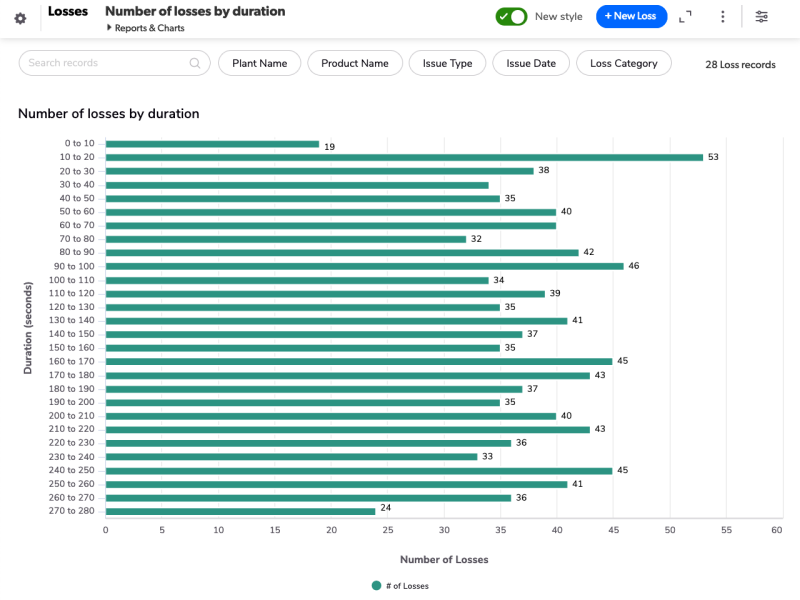
Horizontal bar charts are the same format as a typical bar chart, but turned on its side.
Horizontal Bar Chart
Stacked Bar
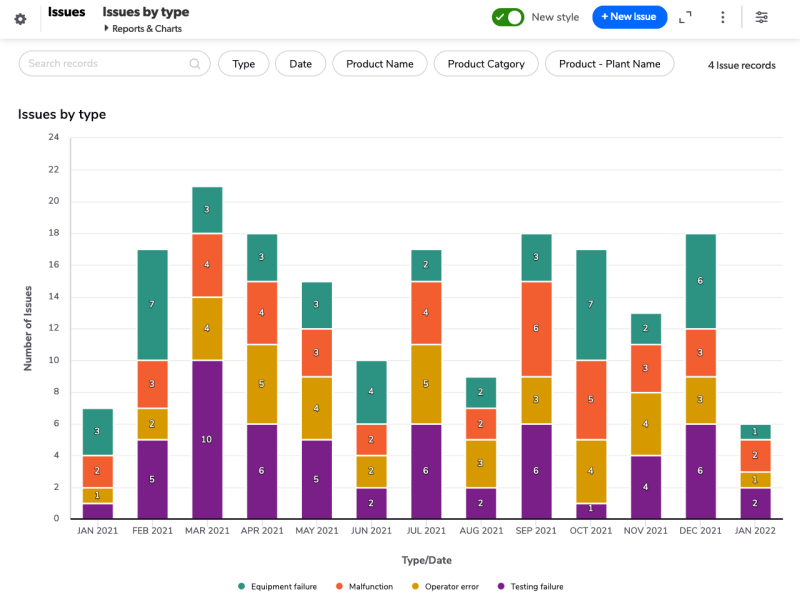
This format combines the comparison features of a bar chart with the proportional illustration of a pie chart. For example, the image below shows issues by type over month. The stacked bar chart below display what type of issues occurred, but stacks them over the month they happened in.
Stacked Bar Chart
Horizontal Stacked Bar
Like the horizontal bar chart pictured above, this format just turns a regular stacked bar chart on its side.
Line
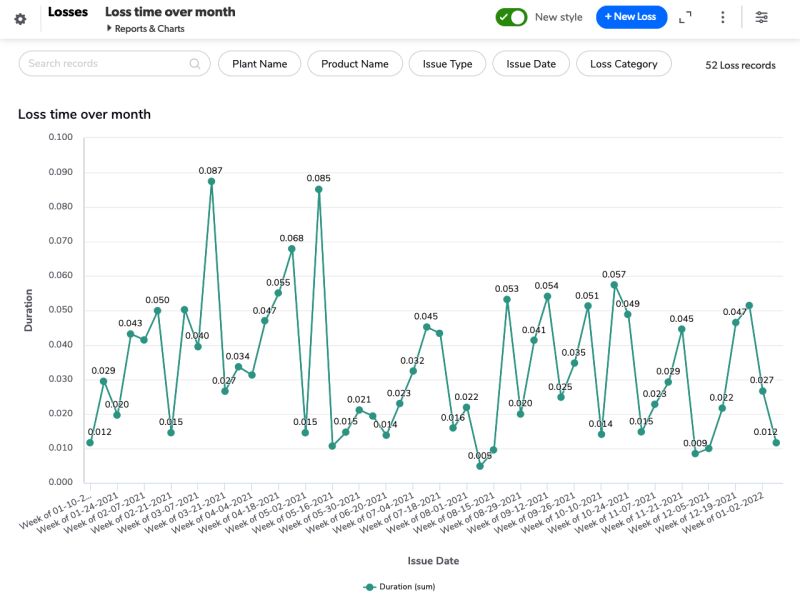
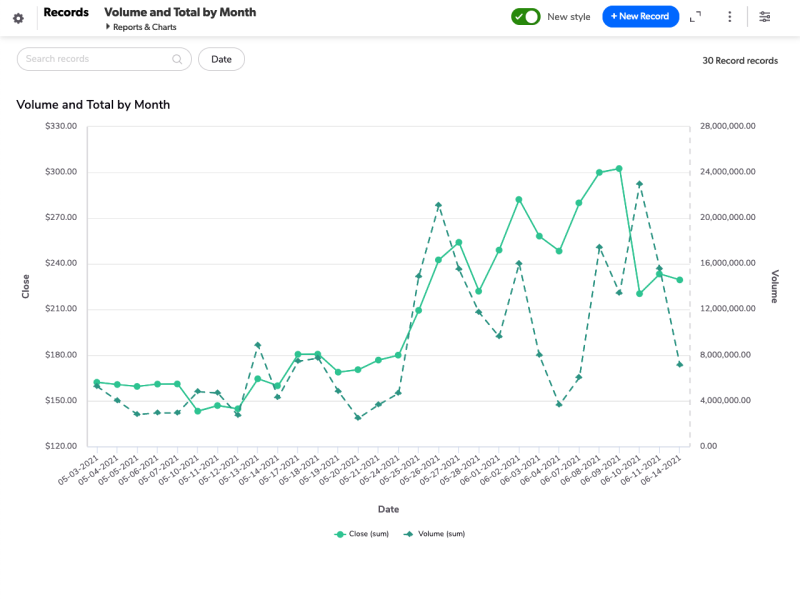
This format helps you track changes through time. Have sales of various instruments been increasing or declining? A line chart can visualize this easily. To drill down, you can click a point to see the records it represents.
Line Chart
You can also display two separate sets of values by adding a secondary (right-side) Y axis, in addition to the values you selected for the primary Y axis.
Line and bar
The Line and bar chart combines the features of both a bar and a line chart in one visual plot.
You can easily distinguish between line values and bar values, so this chart is a quick way to visually compare data sets that have different value ranges, like project cost in the millions and project hours in the thousands. It's also good for visualizing categorical data, like revenue by project type.
You might use a line and bar chart to:
-
see how projects stack up against an average
-
identify high value functioning teams or regions
-
visualize seasonality in your data
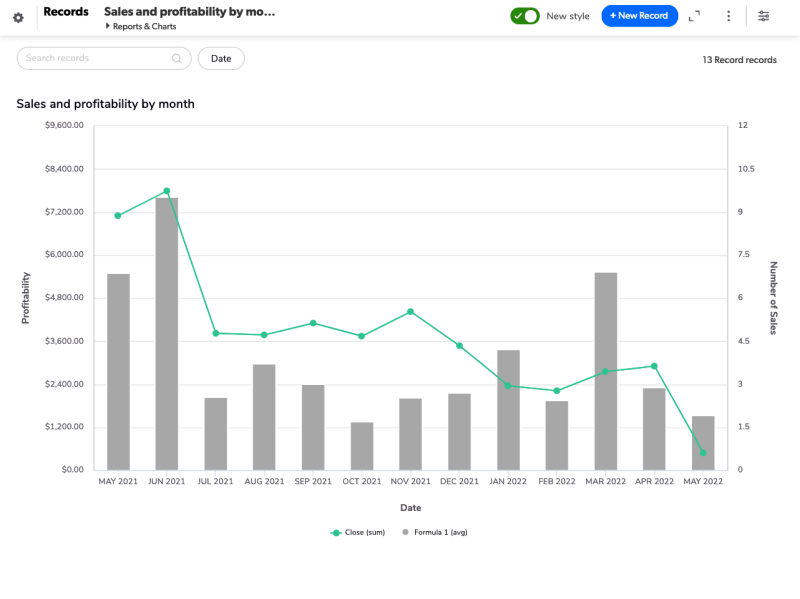
Learn how to create a line and bar chart.
Area
Area charts offer the time-tracking qualities of a line chart and toss in a dash of pie chart proportion measurement. An area chart like the one below can help you see the numbers clearly.

Area Chart
Scatter chart
Use a scatter chart to show correlations and relationships within your data. Scatter charts make it easy to visualize how one data set (the x axis) affects the resulting data set (the y axis). For example, you could use a scatter chart to show how project cost affects return on investment (ROI).
You can also use a scatter chart to see trends and outliers at a glance.
For example, you might use a scatter chart to visualize how your team's actual ticket resolution times compare to their estimated resolution times.
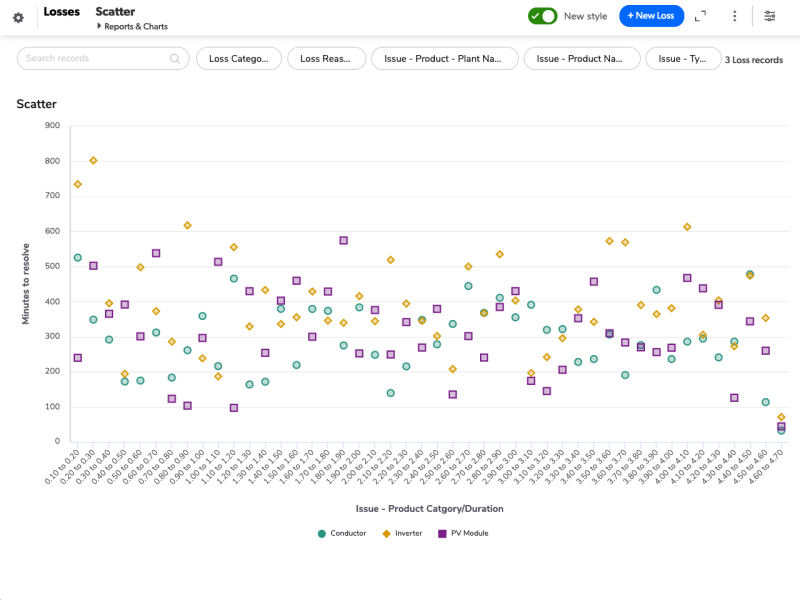
Learn how to create a scatter chart and see examples.
Bubble chart
Use a bubble chart to visualize three dimensions of data on a single chart. Select a field that determines the size of the bubble. Bubbles vary in size according to the values in this field.
Similar to a scatter chart, you can use a bubble chart to show relationships among your data and convey a large amount of numeric information quickly— like prospective sales opportunities per week by dollar amount, probability of close, and stage in the sales cycle.
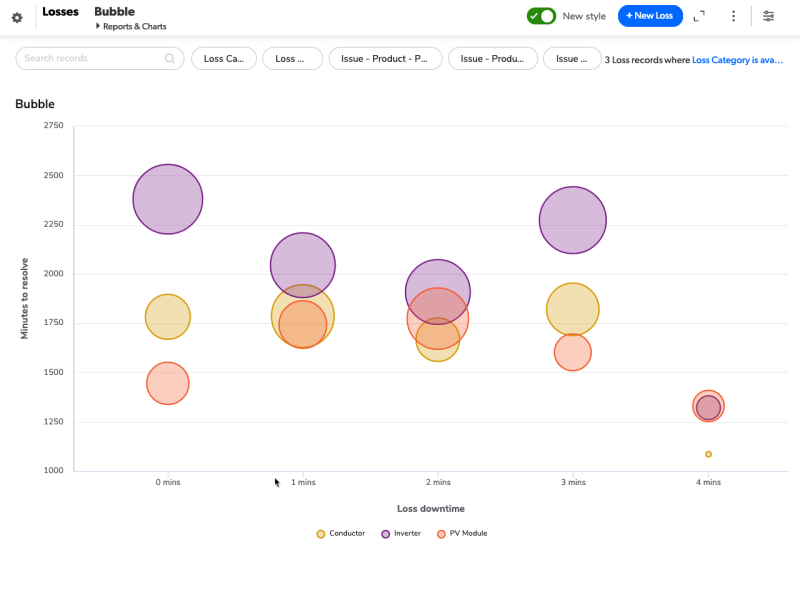
Learn how to create a bubble chart and see examples.
Gauge chart
Use a gauge chart to measure progress against a goal that you set, like the total annual sales.
You can set the number that the gauge starts at, which is usually 0, and the number where it ends, which indicates that the gauge is at 100%.
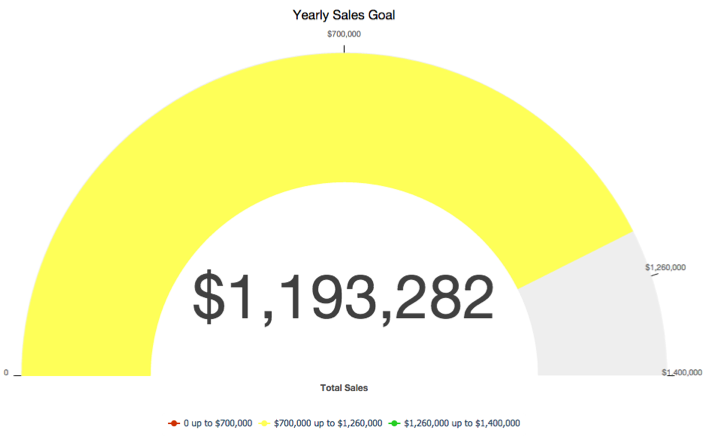
The gauge displays in a single color. The color is based on the percentage of the goal reached and the ranges you define.
Learn how to create a gauge chart and see examples.
Funnel chart
Use a funnel chart to display progress through any process, for example, a project development cycle or a sales pipeline.
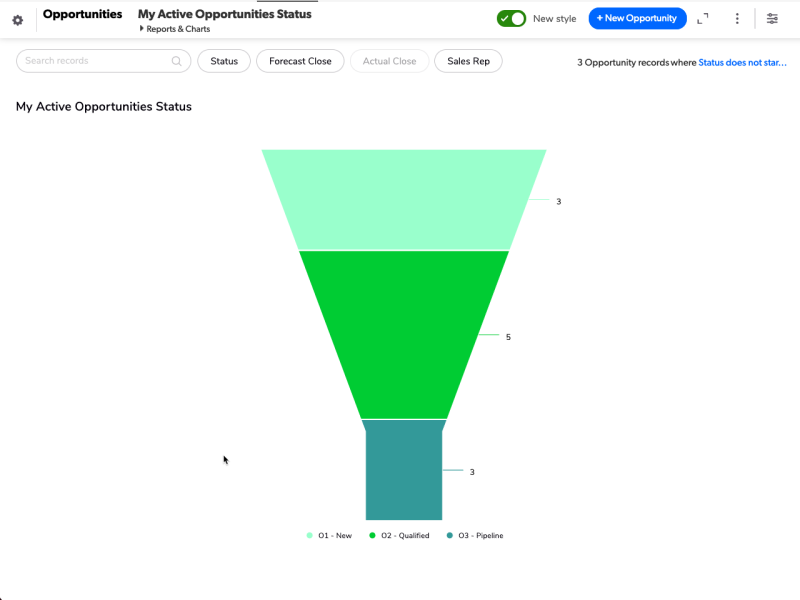
Learn how to create a funnel chart and see examples.
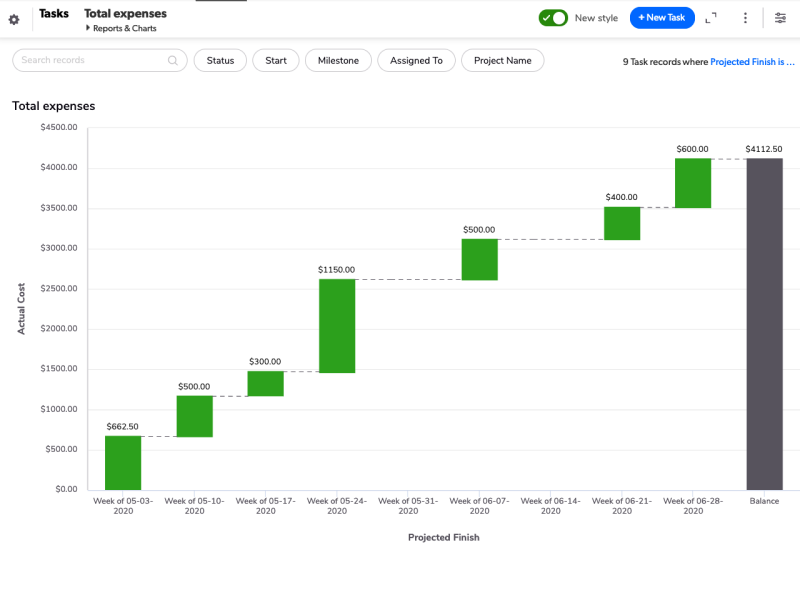
Waterfall chart
A waterfall chart can be useful to illustrate the cumulative effect of changing data, typically to show financial changes due to positive and negative values.