Platform analytics
Platform analytics is included for all customers. Realm admins and account admins can use platform analytics to understand how their entire Quickbase ecosystem is being used. It features key metrics relating to both contract entitlements and general usage that admins should be aware of.
This article covers:
-
Additional info on key metrics:
Viewing your metrics
To view platform analytics, click Quickbase Admin > Manage the realm > Platform analytics. Here you can quickly see which metrics are part of your contract entitlements.
To learn more about entitlements and how they are measured, read the How is Usage Defined and Measured? help article.
Any metric with a gauge is part of your contract as a capped entitlement. These metrics articulate what you’ve used in your contract period to-date, versus what you’ve purchased for the period.

Any metric with a number and no gauge is not a contract entitlement. It may be sub-component (like user reads and integration reads) of a larger metric (total reads), but it is not independently a capped entitlement. See the Technical summary of User and Integration Reads article for more details on how reads are calculated.
Key metrics
To view the definition of any metric, click the “i” icon.
Some apps may be accessible across multiple realms. While metrics for these apps will be shown in all realms where they are used, only the realm that the app owner belongs to will be charged for reads in that app.
Here are some things to keep in mind as you view metric data:
-
In the metric details, if a user shows as "Anonymous," that means the user did not sign in.
-
When a new app is created, it takes Quickbase 24 hours to recognize the name in Platform analytics. This means for the first 24 hours after an app is created, the app name will show as "Pending."
Daily app users
Number of users that access each app each day.
To calculate this number, Quickbase averages the total number of App_IDs accessed in the last 7 days and the total number of User_IDs that accessed apps in the last 7 days.
Total reads
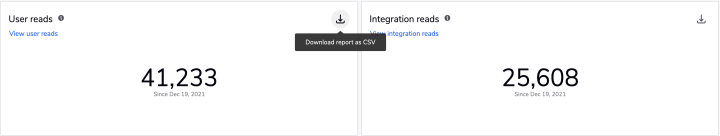
Total number of user reads and integration reads since the start of your latest contract.
User reads
Total number of times since the start of your latest contract that Quickbase displayed any of the following:
-
Form / record
-
Report
-
App home page
-
Dashboard
To export detailed user read information in CSV format, click the download icon .
.
The CSV will include the following columns:
-
App_ID
-
User_ID
-
Date
-
Action
-
User_Agent
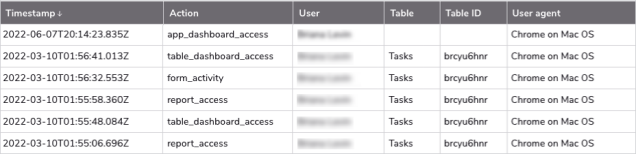
The Action column will show what kind of user read took place. Common actions might be:
-
app_dashboard_access
-
table_dashboard_access
-
report_activity
-
form_activity
The User Agent column can help you understand where the read originated. A user agent contains information about the device the read came from, and will usually look something like this:
-
Mozilla/5.0 (Windows NT 10.0; Win64; x64) AppleWebKit/537.36 (KHTML, like Gecko) Chrome/58.0.3029.110 Safari/537.36
Some other common user agents you may see could look like this at the beginning:
| QuickBase-Native-App-WebView/ | The action originated from the native mobile app, either on Android or iOS |
| Qunect | You are using an external plugin created by our partner QuNect ODBC for Quickbase |
All times listed on read reports are in the UI show in your local browser timezone. Times in the CSV follow ISO 8601 standards.
When you click into User reads, you can view user read data by app, by user, or by app and user.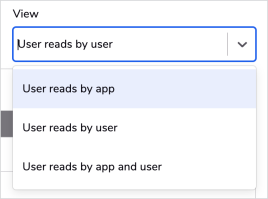
To see more detailed information about the user read, click on the view icon ![]() at the beginning of the row. The columns you see will vary, depending on how you are viewing the data.
at the beginning of the row. The columns you see will vary, depending on how you are viewing the data.
Integration reads
Total number of times since the start of your latest contract that Quickbase delivered data via:
-
A pipeline or API
-
Any read by a user that was not signed in
Billable step runs from Pipelines accrue towards your Integration reads entitlement. For customers on our new plans, there is no longer a separate entitlement related to Pipelines. For more details, see Billing definitions in our Pipelines help.
API calls and reads by non-registered users are tracked based on the account ID. Pipeline events are tracked based on the realm ID, so the numbers will reflect activity from all accounts in the realm.
To export detailed integration read information in CSV format, click the download icon .
.
The CSV will include the following columns:
-
Type
-
Timestamp
-
Action
-
Account_ID
-
Pipeline_ID
-
User_ID
-
Channel
-
App_ID
-
User_Agent
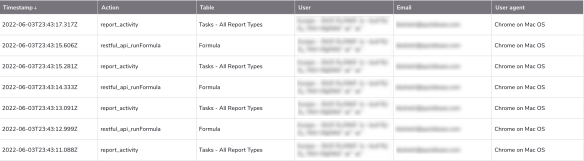
The Action column will show what kind of integration read took place. Common actions might be:
| api_doQuery | Example of a XML API |
| restfulapi_runFromula | Example of a RESTful API |
| pipeline_step | Represents a read from Pipelines |
The User Agent column can help you understand where the read originated. A user agent contains information about the device the read came from, and will usually look something like this:
-
Mozilla/5.0 (Windows NT 10.0; Win64; x64) AppleWebKit/537.36 (KHTML, like Gecko) Chrome/58.0.3029.110 Safari/537.36
Some other common user agents you may see could look like this at the beginning:
| QuickBase-Native-App-WebView/ | The action originated from the native mobile app, either on Android or iOS |
| Qunect | You are using an external plugin created by our partner QuNect ODBC for Quickbase |
All times listed on read reports are in the UI show in your local browser timezone. Times in the CSV follow ISO 8601 standards.
When you click into Integration reads, you can view integration read data as API calls by app, API calls by user, or Pipeline reads by pipeline.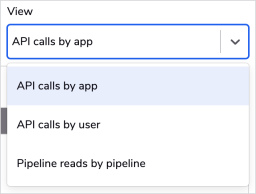
To see more detailed information about the integration read, click on the view icon ![]() at the beginning of the row. The columns you see will vary, depending on how you are viewing the data.
at the beginning of the row. The columns you see will vary, depending on how you are viewing the data.
Days into contract period
Number of days elapsed since your current contract period began, compared to the total number of days in this period
Users with access
Number of user licenses that are currently provisioned, compared to the number of user licenses purchased.
File attachment space
Amount of file attachment space that your apps currently use, compared to the amount purchased.
App space
Amount of space your apps currently used, compared to the amount purchased
Related topic: